InvERP's analytics gives you real-time visibility into every corner of your shop — sales trends, top products, staff performance, and financial health — all in one dashboard.
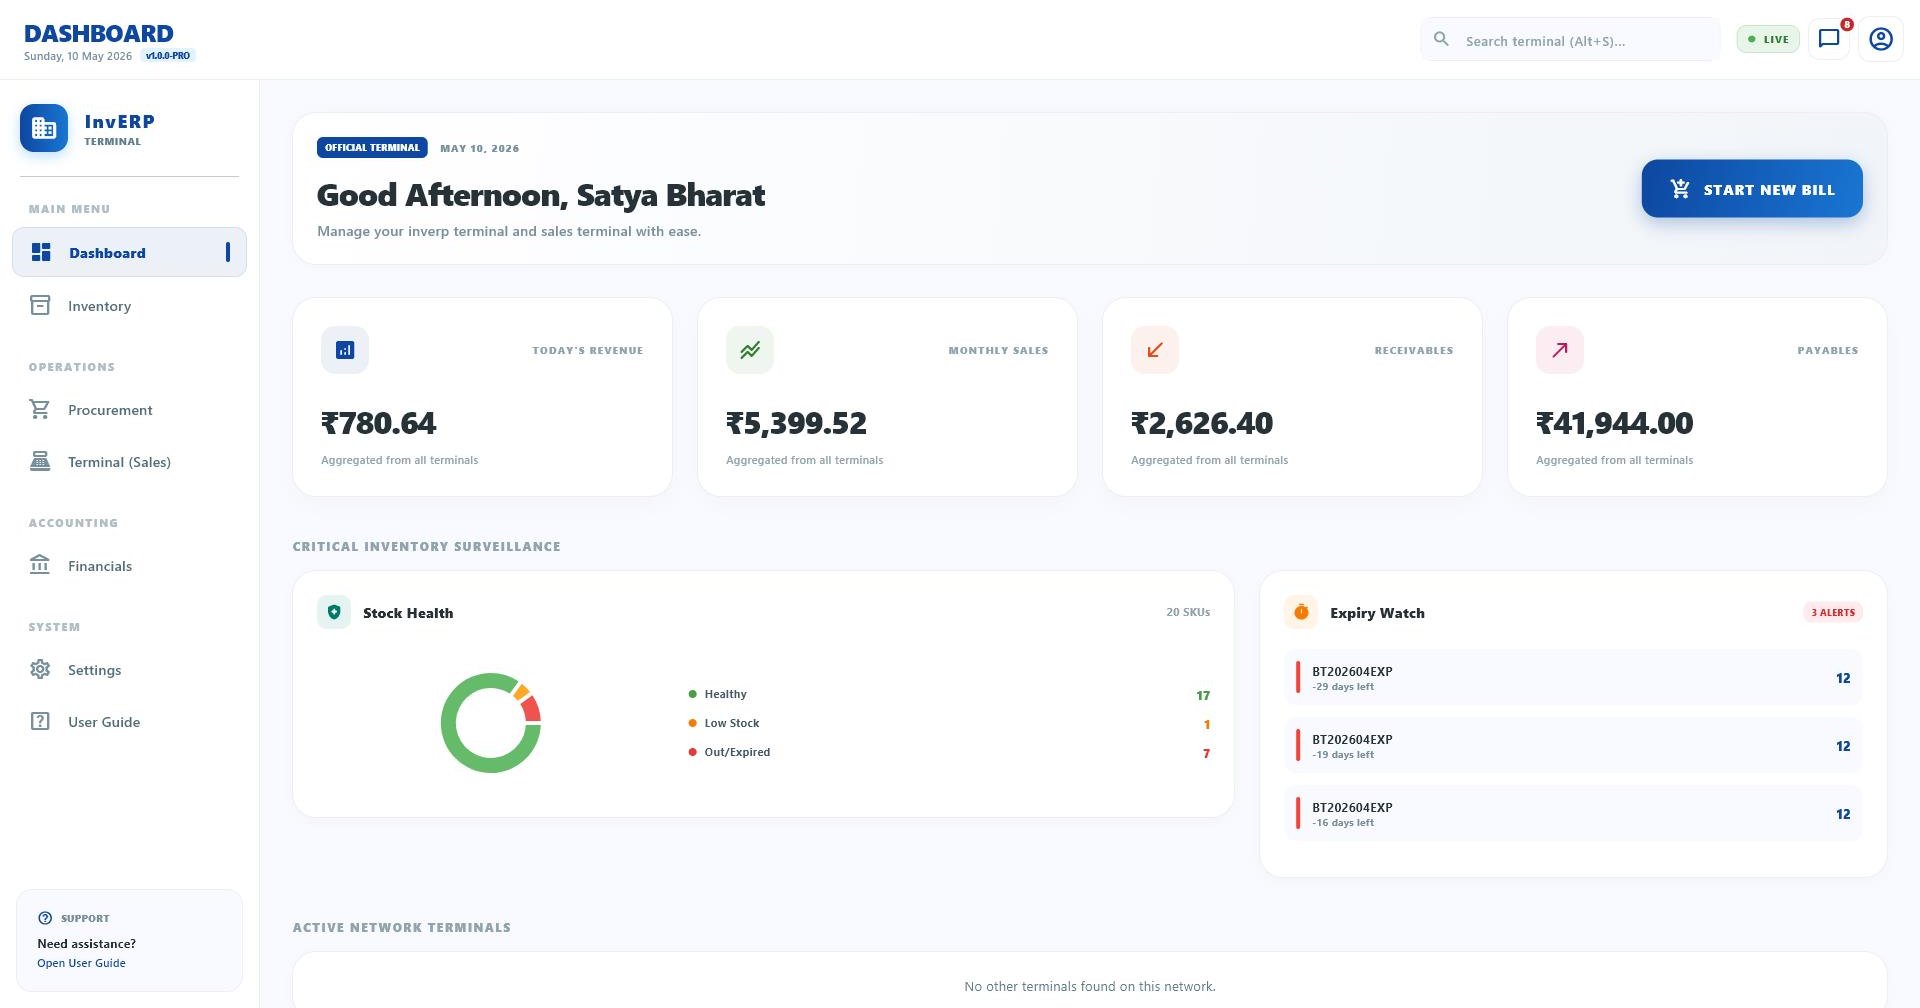
Real-time sales KPIs — today's revenue, this week, this month, and comparison to previous periods.
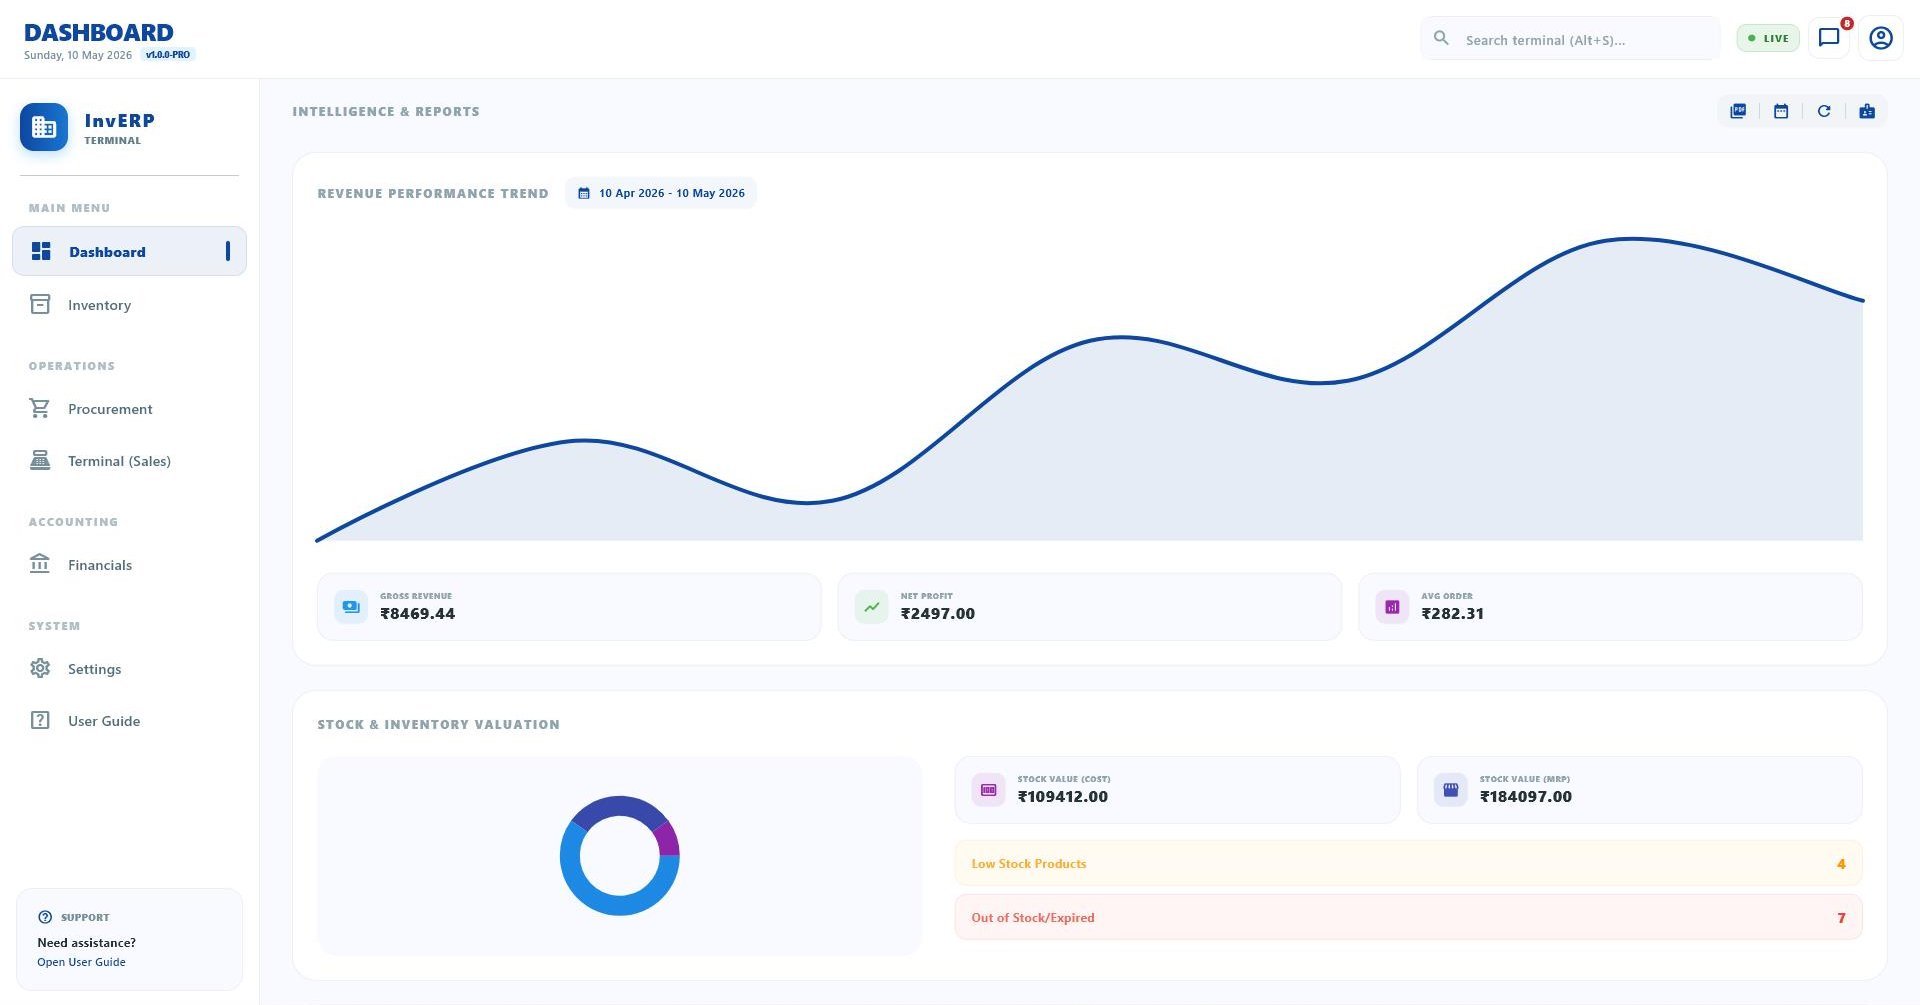
Daily, weekly, and monthly sales charts. Identify peak days, slow periods, and growth trends.
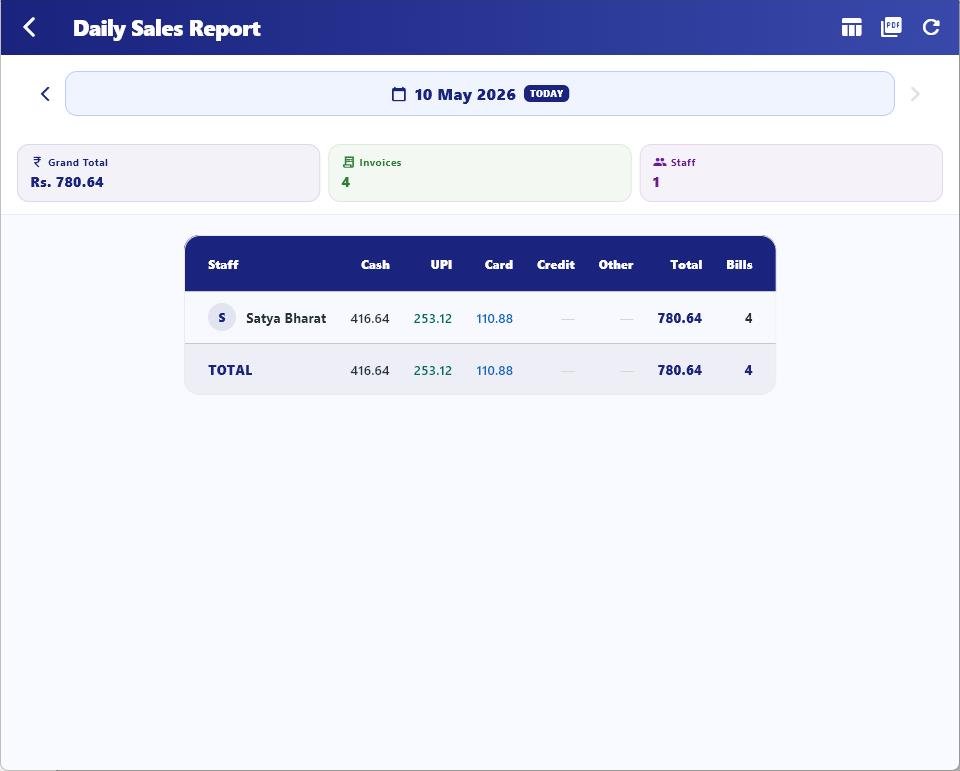
Detailed end-of-day report — total sales, collections, returns, expenses, and net cash position.
Sales breakdown by product category and sub-category. Know which categories drive your revenue.
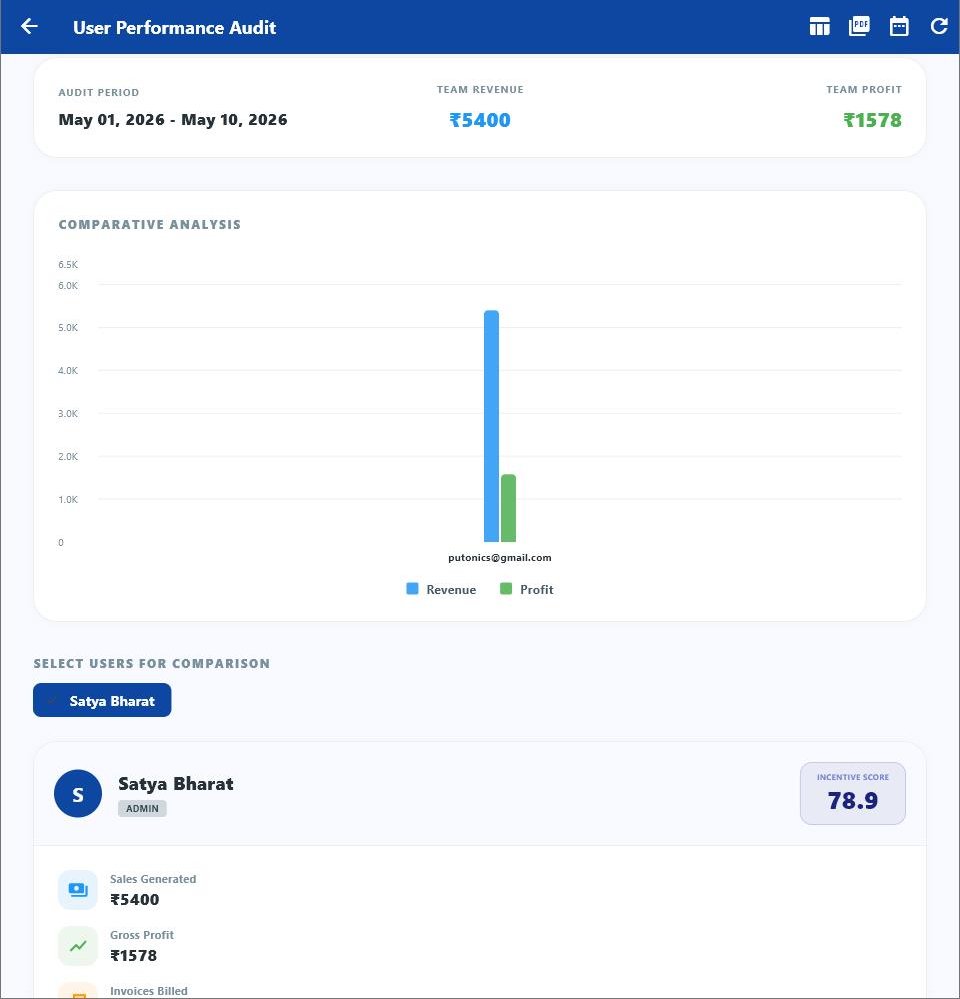
Track each staff member's billing volume, transaction count, and sales amount for performance reviews.
Identify your best-selling products, highest revenue products, and slowest-moving inventory.
Top customers by revenue, purchase frequency, and outstanding dues. Know your VIP customers.
Compare any time period — today vs yesterday, this month vs last month, this year vs last year.
Open InvERP and immediately see how your shop is performing. The dashboard surfaces the most important KPIs — sales, collections, top products, and alerts — at a single glance.
Go beyond the headline numbers. Drill into sales by date, product, category, staff, or customer. Export any report to Excel or PDF for further analysis.

Know exactly how each staff member is performing. Track billing volume, invoice count, sales amount, and compare across staff to reward top performers and identify gaps.
The daily sales report is your end-of-day summary — total sales, cash collected, UPI received, credit extended, returns processed, and expenses for the day.
Download InvERP and get real business intelligence — not just data, but actionable insights.